2.2.2 Coffee Bean State
Based on color, coffee beans have two states: green coffee beans and roasted brown coffee beans. During the roasting process, green coffee beans turn dark brown due to the dynamic reduction and decomposition of components such as sucrose, polysaccharides, chlorogenic acid, free amino acids, nicotine, and proteins, which increases bitterness and intensity. The percentage of weight loss of coffee beans during roasting depends on the degree of roasting and the specific roasting method. Generally, as the degree of roasting deepens, the weight loss increases, and the color also darkens, which can be observed with the naked eye. In terms of texture, coffee beans lose their flexibility and deformability during roasting while increasing their brittleness. Additionally, different roasting conditions significantly affect the pore structure of coffee beans. Low-temperature roasting tends to produce coffee beans with smaller pore volumes and finer micropores in the cell walls.
Defects can appear on both green and roasted coffee beans, and these defects may have originated during the roasting process. Irreversible defects in green coffee beans are caused by physical, chemical, and biological damage. Common physical damage includes fragments and husk residues. Typically, chemical damage in coffee beans manifests as changes in external visible features, such as black beans and dehydration, leading to color changes and surface shrinkage. Additionally, insect damage is one of the main biological issues in green coffee beans. For brown coffee beans, improper roasting operations may lead to various defects, such as over-roasting or under-roasting on the inside or outside.
HSI is particularly sensitive to visible external defects, especially when utilizing its spatial data sets. Chen et al. conducted two experiments on defective green coffee beans. In their study, the coffee beans were divided into four groups: black beans, dehulled beans, insect-damaged beans, and healthy beans. The PCA algorithm was applied in both studies, with the optimal wavelengths extracted, and the number and values of the selected components varied (see Table 3). In their first paper, they used constrained energy minimization-SVM (CEM-SVM) and convolutional neural networks (CNN) for identification, achieving a high overall classification accuracy of over 95%. Subsequently, they emphasized implementing CNN in multiple dimensions (2D and 3D) and combined 2D-3D, targeting spatial, HSI cubes, and merged convolutional architectures, respectively. Through this approach, they achieved overall classification accuracies of 94.1%, 98.2%, and 98.6% using only three optimal wavelengths of 813, 826, and 843 nm. In contrast, Oliveri et al. compared the near-infrared hyperspectral images of normal green coffee beans with those of bean slices, black beans, and cherries, as well as dehydrated beans. Only two principal components were selected during the PCA process, and the k-nearest neighbor (k-NN) method performed relatively well in predicting the healthy group and dehydrated beans, with correct percentages close to 90%. However, the performance of defect detection in roasted beans seems to be less superior to that of unroasted beans. Cho et al. compared a medium-roast control group with four different defects induced by controlling roasting temperature and time. They differentiated between different samples using chemical changes and browning index. After standard normal variable (SNV) preprocessing, they achieved an 86.2% correct classification rate using partial least squares discriminant analysis (PLS-DA). Reducing the number of key components extracted can enhance system response and overall performance. However, this may lead to a decrease in accuracy. Therefore, accurately identifying coffee bean defects while minimizing the number of primary elements used for analysis to maintain efficiency and precision is crucial.
2.2.3 Grinding and Brewing Stage
Typically, defects in ground coffee beans are external, including impurities and adulterants. Since these defects have already been discussed in Section 2.1.3 as part of compositional analysis, they are not repeated here. Beyond the grinding stage, the quality of coffee during the final brewing process may vary due to factors such as temperature, pressure, water quality, coffee-to-water ratio, particle distribution, and brewing time. The main defects in coffee beverages include sediment and flavor loss. For the former, if the coffee is not fully filtered or dissolved, especially in brewing methods like immersion, French press, and pour-over, coffee sediment may occur. For the latter, the flavor of the coffee beverage primarily depends on the previous state of the coffee beans, as the chemical components contributing to flavor formation are established after roasting and tend to stabilize dynamically. Spectral analysis is a powerful tool for feature extraction and characterization. Using near-infrared spectroscopy with machine learning and deep learning algorithms, Chang et al. developed and visualized a flavor prediction model for ground coffee. Additionally, Caporaso et al. provided a HSI-based aroma prediction method for coffee, focusing on individual roasted coffee beans and considering various complex bioactive components. However, these studies have not achieved sufficiently high prediction accuracy, and relatively subjective sensory evaluations may to some extent influence the results.
Despite the widespread application of hyperspectral imaging in food and agricultural safety and quality assessment, its implementation in liquids has been limited, with liquid objects primarily including juice, milk, yogurt, and oil. The main issue is that liquids, especially relatively clear liquids (like coffee), have low reflectance and smooth curves, making interference elimination and attribute differentiation difficult. Despite this challenge, several innovative methods have been proposed to present the spectral characteristics of liquids. Pelta et al. mixed a white-enhancing substance into liquid samples to reduce transmission components, enhance reflection spectra, and obtain more identifiable spectral features, although this is an irreversible destructive method. Wang et al. proposed two methods, called Particle Swarm Dual-Thickness Transmission (PTT) and Particle Swarm Transmission and Reflection (PTR), combining Particle Swarm Optimization (PSO) algorithms to enhance the characterization of optical constants. Another method is to use other spectral indices instead of reflectance, such as absorbance, transmittance, and diffuse reflectance. However, as far as the authors know, there have been no studies using hyperspectral imaging on coffee beverages, let alone specific defects in brewed coffee liquids, indicating that more effort is needed to explore this field.
2.3 Identification and Classification
Hyperspectral imaging is typically used for feature comparison and characteristic classification, often combined with machine learning algorithms. In the agricultural and food industries, product identification or classification is usually based on nutritional content, grade, general quality, origin, freshness, contamination, etc. For coffee classification, variety or origin identification, as well as characteristics including roasting degree and predicted flavor, are two major application areas where HSI shows significant potential, with its performance considered suitable for practical use in industry.
2.3.1 Identification of Coffee Varieties or Species
The World Coffee Research (WCR) provides a detailed and comprehensive catalog tool for coffee varieties for farmers, producers, and consumers, covering two main cultivated coffee varieties from over twenty countries: Arabica (Coffea arabica) and Robusta (Coffea canephora). It is also the first organization to collect and compile key information on 55 Arabica and 47 Robusta coffee products. According to the WCR, although there are currently over one hundred coffee varieties or cultivars, each unique and stable coffee variety has a set of specific attributes that can be precisely described and distinguished from other varieties, which aligns with the definition of variety by the Union for the Protection of New Varieties of Plants (UPOV). Additionally, the characteristics of two different coffee varieties or species can be significantly different; for example, Bourbon coffee (belonging to the Arabica species) has green leaf tips, medium-sized beans, and a moderate yield potential, while Typica coffee (also belonging to the Arabica species) has bronze-colored leaf tips, larger beans, and a lower yield. Pedernera coffee (belonging to the Robusta species) has smaller, rounder beans and greater tolerance to coffee rust and nematode diseases, all of which are reported by the WCR. Therefore, using hyperspectral imaging technology to perform online classification of different coffee varieties from different origins has practical application value, as they often have different qualities, prices, or preferences of specific consumers due to their distinct physical and chemical properties. To date, some hyperspectral imaging experiments have been successfully conducted, focusing on distinguishing Arabica and Robusta (see Table 4). Generally, the typical process involves initially analyzing the external physical differences of coffee beans and their internal chemical composition, establishing correlations between traditional measurements and HSI datasets, and then further classifying based on the previously established correlations. Most of these models have achieved over 80% correct classification accuracy.
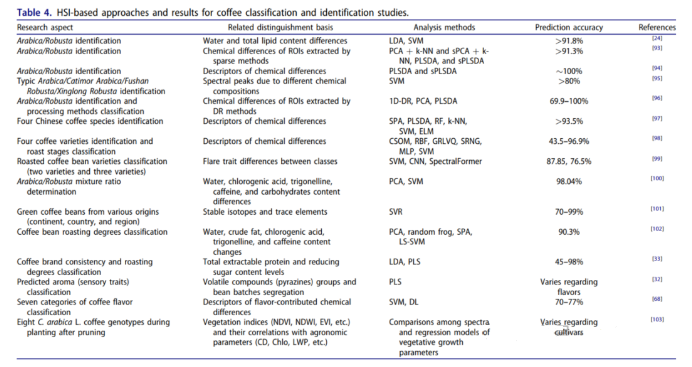
Additionally, research has been conducted on more refined classification of coffee varieties, considering the cultivation origin. For example, Bao et al. utilized near-infrared hyperspectral imaging combined with five discriminant models to describe and identify four native coffee bean varieties in China; Backhaus et al. achieved real-time identification of four green coffee bean varieties using shortwave infrared hyperspectral imaging, accelerating the hardware system; Makarov et al. compared two and three coffee bean varieties based on flicker features in hyperspectral images, where the three-dimensional convolutional network algorithm respectively achieved the highest average classification accuracy of 87.85% and 76.5%. Furthermore, due to the differences in appearance and flavor between Arabica and Robusta coffee beans, their market prices may also vary. Typically, the former is primarily used for single-origin or specialty coffee production, while the latter tends to be used in coffee blends and instant coffee. Therefore, the ratio of Arabica and Robusta in coffee blends is crucial for product quality. Correspondingly, Sahachairungrueng et al. performed principal component analysis and used the support vector machine algorithm to compare pure samples of Arabica and Robusta coffee with ground coffee blends, ultimately successfully determining these two coffee varieties using qualitative or quantitative indicators. All related research has achieved some satisfactory results; however, more breakthroughs are needed in the integration and systematization of equipment at the aforementioned software data management level. Nevertheless, it is reassuring that innovative ideas continue to emerge. For instance, Sim et al. based on hyperspectral imaging within the 700-1700 nm wavelength range, predicted 41 trace elements and 5 stable isotopes on green coffee beans from different production scales (continents, countries, and regions), where eight trace elements and three isotopes achieved an R² value of over 0.70 in the predictions, providing new perspectives for coffee quality assessment and origin verification.
2.3.2 Classification of Coffee Characteristics
Roast level is one of the most important attributes of coffee, being significant for both coffee merchants and consumers. Generally, there are four main roast levels: light roast, medium roast, medium-dark roast, and dark roast, while some roasters use seven more detailed categories to describe roast levels. More specifically, each roast level has different grades based on specific roast conditions, for example, typical roasts within the medium roast range include city roast, American roast, and breakfast roast. Due to the significant physical and chemical changes that coffee beans undergo during roasting, particularly in terms of bean color and moisture loss, HSI (Hyperspectral Imaging) can non-destructively assist in classifying different roast levels. It is worth noting that the criteria for HSI technology may vary, as many characteristics change dynamically during coffee roasting, leading to the selection of multiple classification methods. As collected in Table 4, Chu et al. chose to distinguish different roast levels based on changes in the content of components such as moisture, crude fat, chlorogenic acid, nicotine, and caffeine; additionally, another study by Nansen et al. focused more on the levels of total extractable protein and reducing sugar content for grading roasted coffee beans. Beyond roast level, Nansen et al. also studied the consistency between actual coffee products and their brands, providing strong evidence for the feasibility of using HSI combined with several quality descriptors in brand supervision in the commercial beverage industry. Furthermore, sensory evaluation of coffee with characteristic flavors is also of great importance for the drinking experience. Caporaso et al. tested a series of volatile chemicals, although they proposed predictive models for batches with nutty and other flavors, individual models for volatile components and aroma or odor were not sufficient for good estimation, possibly due to the low content of these chemicals and the difficulty of sensory judgment. Similarly, Chang et al. attempted to predict seven coffee flavors, but the final accuracy was below 80% (see Table 4). Despite these studies aiming to achieve better models, they provide an innovative framework for coffee flavor prediction, combining quantitative indicators provided by HSI, while current sensory evaluation of coffee flavors is still conducted by professional institutions using professional indicators. Additionally, coffee hyperspectral characterization can also be implemented during the cultivation period. Menezes Freitas et al. used vegetation indices based on hyperspectral reflectance to quantify the structural and biochemical characteristics of coffee leaves, distinguishing genotypes, and evaluated eight coffee varieties. The results showed that hyperspectral reflectance curves could distinguish eight C. arabica L. coffee varieties, and vegetation indices performed excellently in estimating agronomic parameters of coffee, including chlorophyll a (using the photochemical reflectance index, RMSE of 2.39%) and plant height (using the normalized difference moisture index, RMSE of 5.78%). These studies demonstrate the potential of HSI at the front-end and back-end of the coffee industry.
Related products: please click here